


The Murder Rate has Plunged Since 1990 … But Big Gov Knows How to Turn That Around
Don't overlook a generation of progress. But also don't overlook how big government can mess things up.
Recent high-profile mass killings of citizens and police here in the U.S., combined with the immediacy of social media, has many people convinced that American civilization is unraveling. These people aren’t necessarily wrong, but it’s well to put events in context so as not to exaggerate the situation.
Let’s look first at the overall homicide rate, and then at the rate of violent deaths among police.
The U.S. Murder Rate — Up, Down and Up, But Mostly Down Over the Past 25 Years
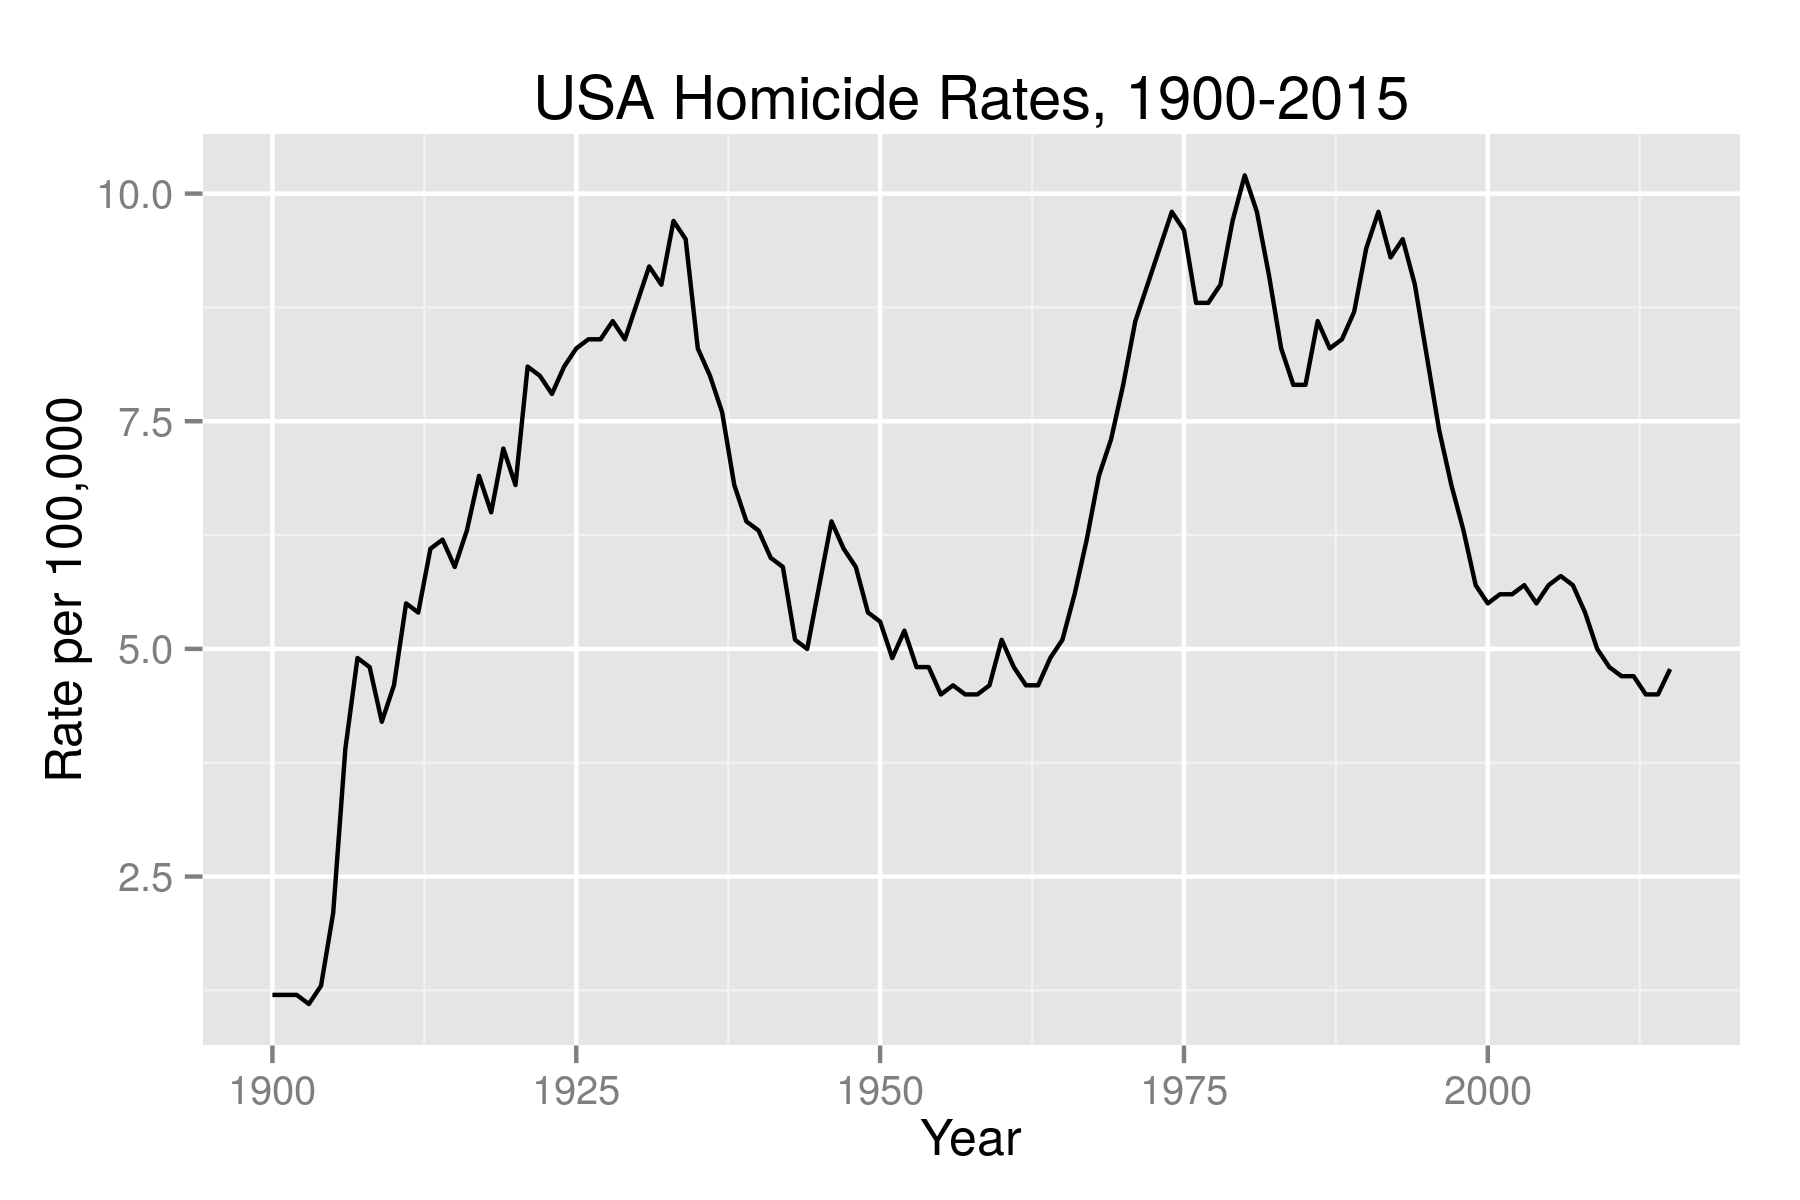
The homicide rate for these once United States was about 4.8 per 100,000 in 2015, a slight uptick from the 4.5 in 2014, but a number still far below a peak of 10.2 in 1980. Homicide is defined as murder and non-negligent manslaughter. A picture of the rates from 1900 shows considerable variation and some noticeable peaks and valleys. These changes call for an explanation.
First, a caution on the precision of the numbers. These charts are based on evolving estimates of local and state murder and manslaughter totals, estimates of the ways these homicides were committed and by whom, and estimates of the population. The Census Bureau, FBI and the Bureau of Justice Statistics of the U.S. Department of Justice are ever tweaking these figures, and those of the earliest and latest years must not be trusted for perfect accuracy. Adjustments, when they happen, have been around 2% or less.
The estimates in the main figure are from the Bureau of Justice Statistics in the Department of Justice and from the FBI.
The rapid increase from 1920 through roughly 1933 can be explained in part by the United States Government modifying the Constitution to ban the sale of alcohol and that ban’s role in the rise of organized crime. But that government maneuver doesn’t explain the uptick starting after 1900. Another policy might, though.
It was in the first decade of the 20th century that immigration dramatically rose, with over 9 million new souls entering the country. Crime rates rose simultaneously. Not all new crime was committed by immigrants, though many at the time thought so. Instead, crime rose among immigrants and the native born, as a result of clashing cultures.
The federal government, sobering up, re-amended its Constitution at the end of 1933 and graciously allowed its citizens to again have a beer on a hot day. The homicide rate accordingly dropped. It picked up immediately after World War II when the nation turned from killing enemies to again killing each other.
In 1964 the rate was 4.9, just higher than in 2015. It was then the War on Poverty began, accompanied by Sexual Liberation, both corrosive of traditional family life. Homicide rates increased. Also in the mix were the Baby Boomers coming into their teens and twenties, the time when homicidal rages are at their peak (as we shall see below).
Demographic changes and a quieting in the crack epidemic (which ran in the mid 1980s to early 1990s) saw homicide rates drop starting in the mid 1990s. Yet wholesale immigration is being pushed again, and the recent events associated with Islamic terror and Black Lives Matter will produce an uptick in 2016. But even so, we are still at relatively low rates, and this is to be celebrated.
The War on Cops — Happily, Not What It Used to Be
Another sharp rise in 2016 will be in the number of policemen killed on duty. Rates before this year were on their way down, as this plot from National Law Enforcement Officers Memorial Fund data shows:

As before, caution in the numbers is warranted, particularly for historical data. Yet it’s astonishing how well this plot tracks the overall homicide rate. The War on Alcohol, the War on the Family (or Tradition), and the 9/11 attack are all there and plain. Also obvious is the effects of increased immigration.
The number of police killed in 2015 was 123. As of 18 July of this year, there were 63 deaths, which is slightly higher than last year. If the trend holds, the deaths will be up in 2016 about 5%. The kinds of killings this year, such as the assassinations in Baton Rouge, are of a different and more frightening note, of course. Even so, the public-as-a-whole’s confidence in the police, according to Gallup, has remained more or less constant since 1993.
It’s also important to note that it’s not only crime that determines the homicide rate among police officers or the public. Better trauma care at hospitals saves more lives, and improved body armor of police prevents more deaths.
The War on Tradition Has Hit the Black Community Hard
The War on Tradition has hurt blacks the most, as these next plots show. The first is the homicide rate from 1980 through 2008 for blacks and whites, broken down by those killed and killers. These data are also from the Bureau of Justice Statistics, which (along with the FBI) stopped publishing racial breakdowns in the year President Obama was elected (as has been noticed by others).
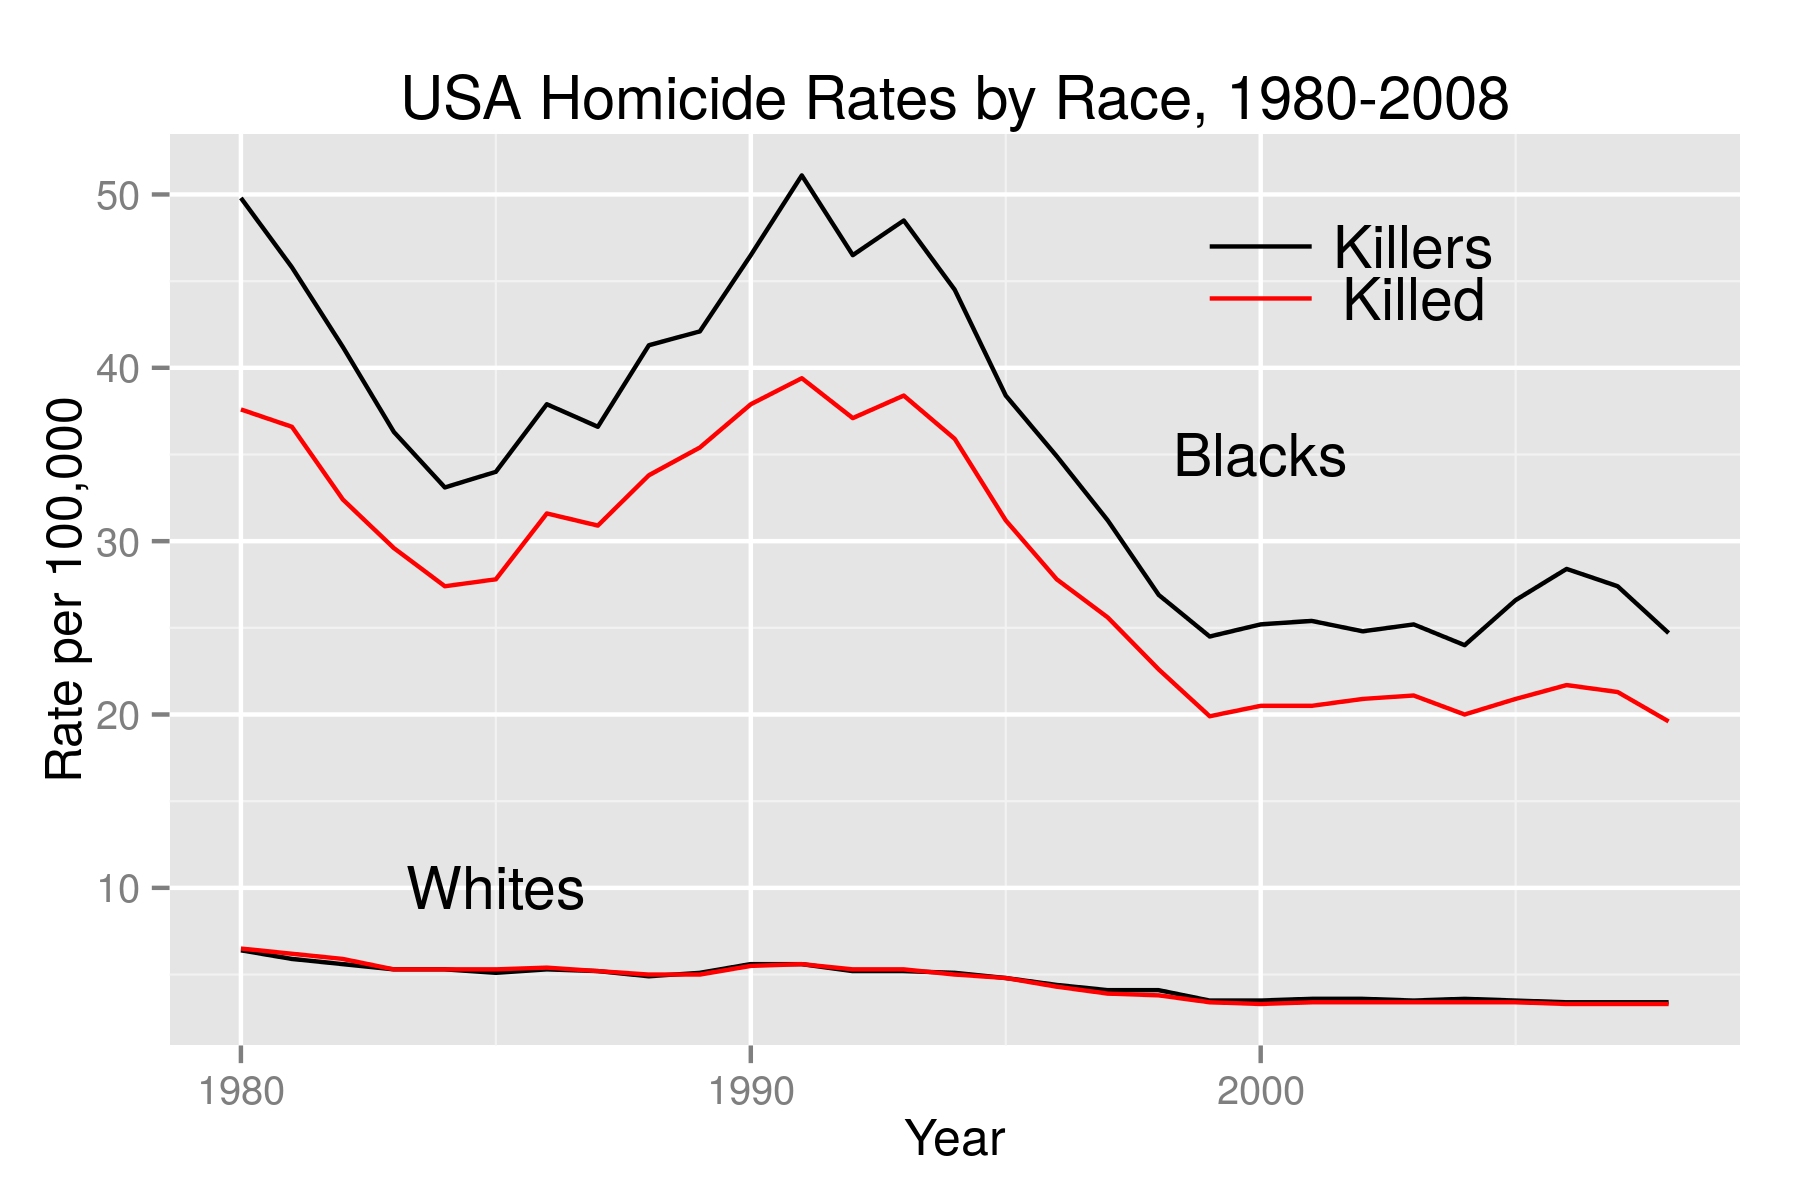
The black homicide rate is about 7 to 8 times the white rate, and not only that, blacks kill at higher rates than they are killed. Similar plots in crime rates can be shown for felonies of all types. These enormous disparities between the races (in which for example the crack epidemic is plain) accounts for the different attitude police have towards blacks and whites, and blacks accordingly have toward police. Given that the black marriage rate, legitimacy rate and other social measures were far better before the government and the caring professions started their earnest work in the 1960s, we can see that President Reagan was onto something when he said the nine scariest words are “I’m from the government and I’m here to help.”
Age plays a role, for males and females, as these charts, also from the BJS, show. First, males.
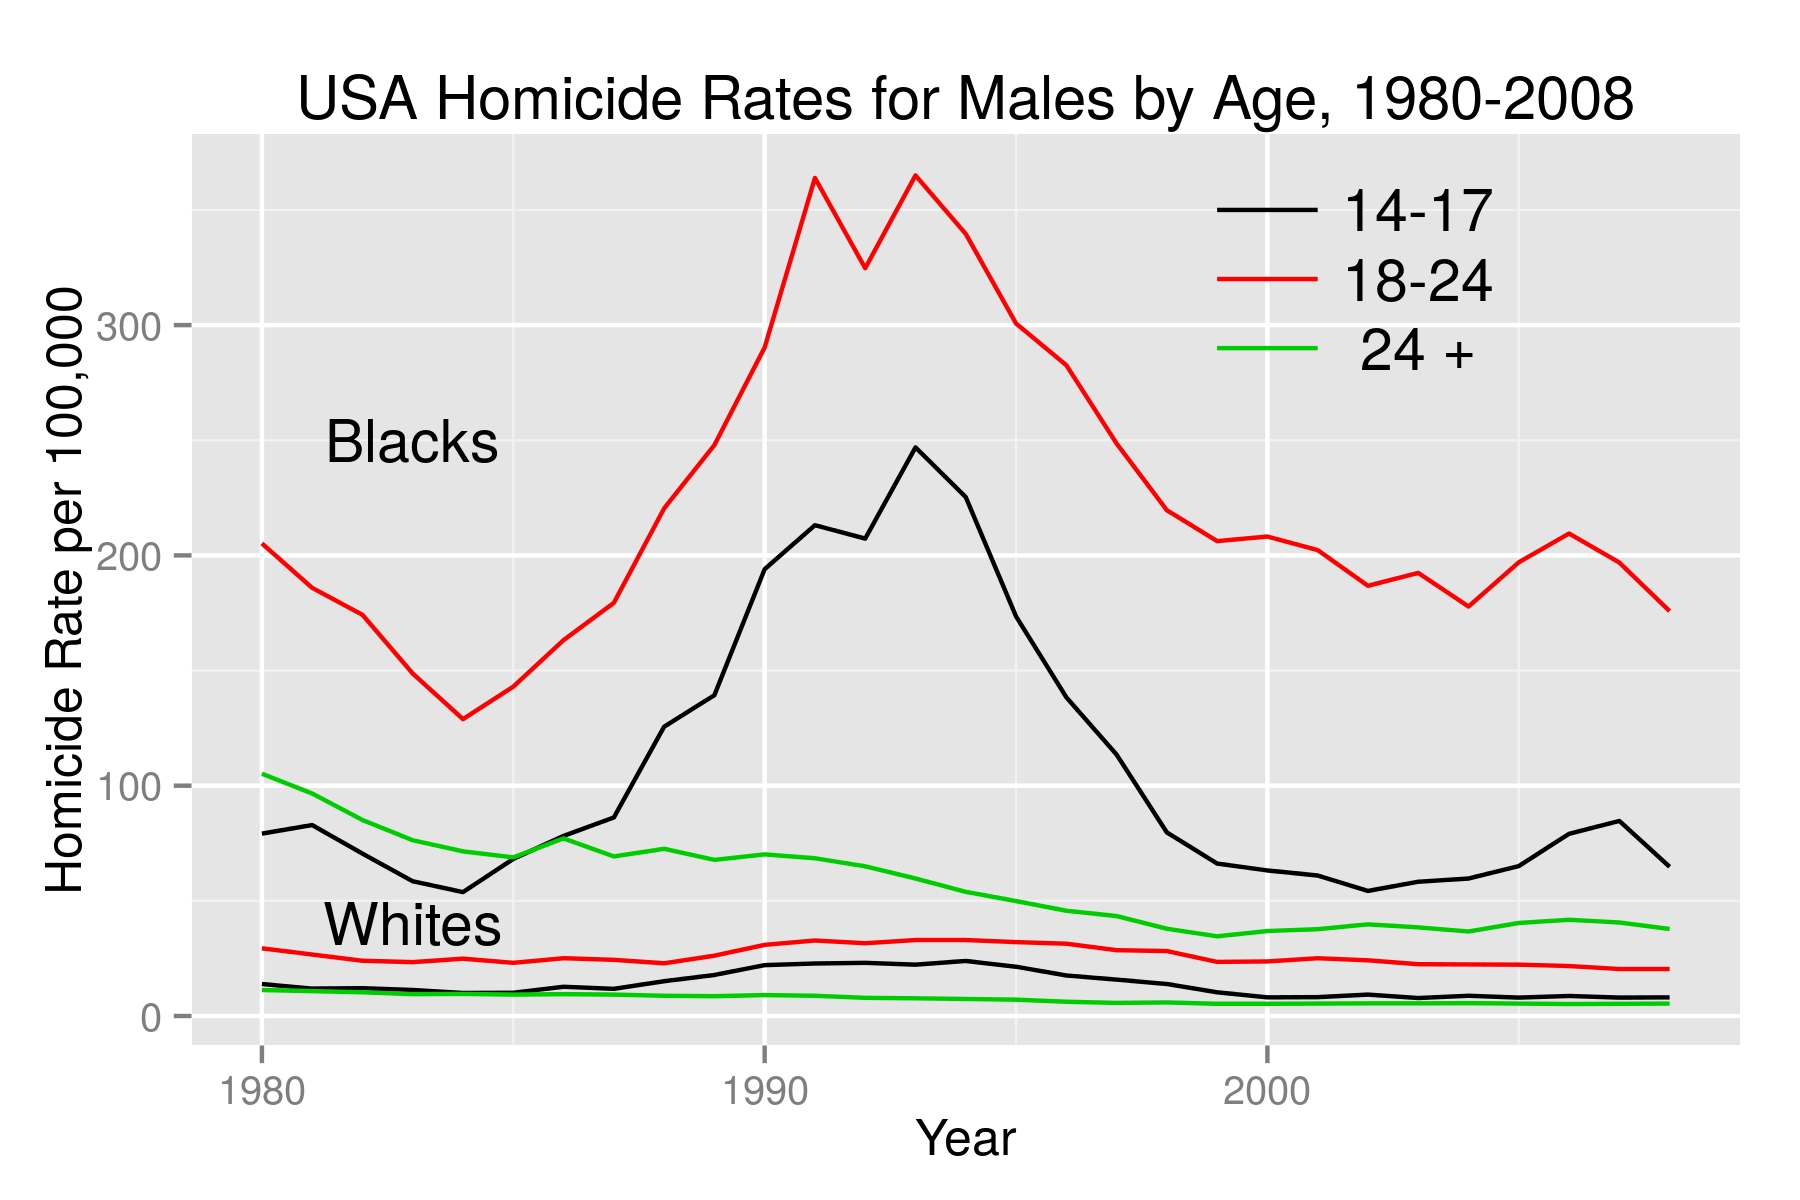
For both black and whites, the homicide rates are highest for 18- to 24-year-olds, and lowest for those over 24. But it’s obvious the rates are enormous for black males 18-24, though they have been decreasing or leveling off in recent years. Next, females.
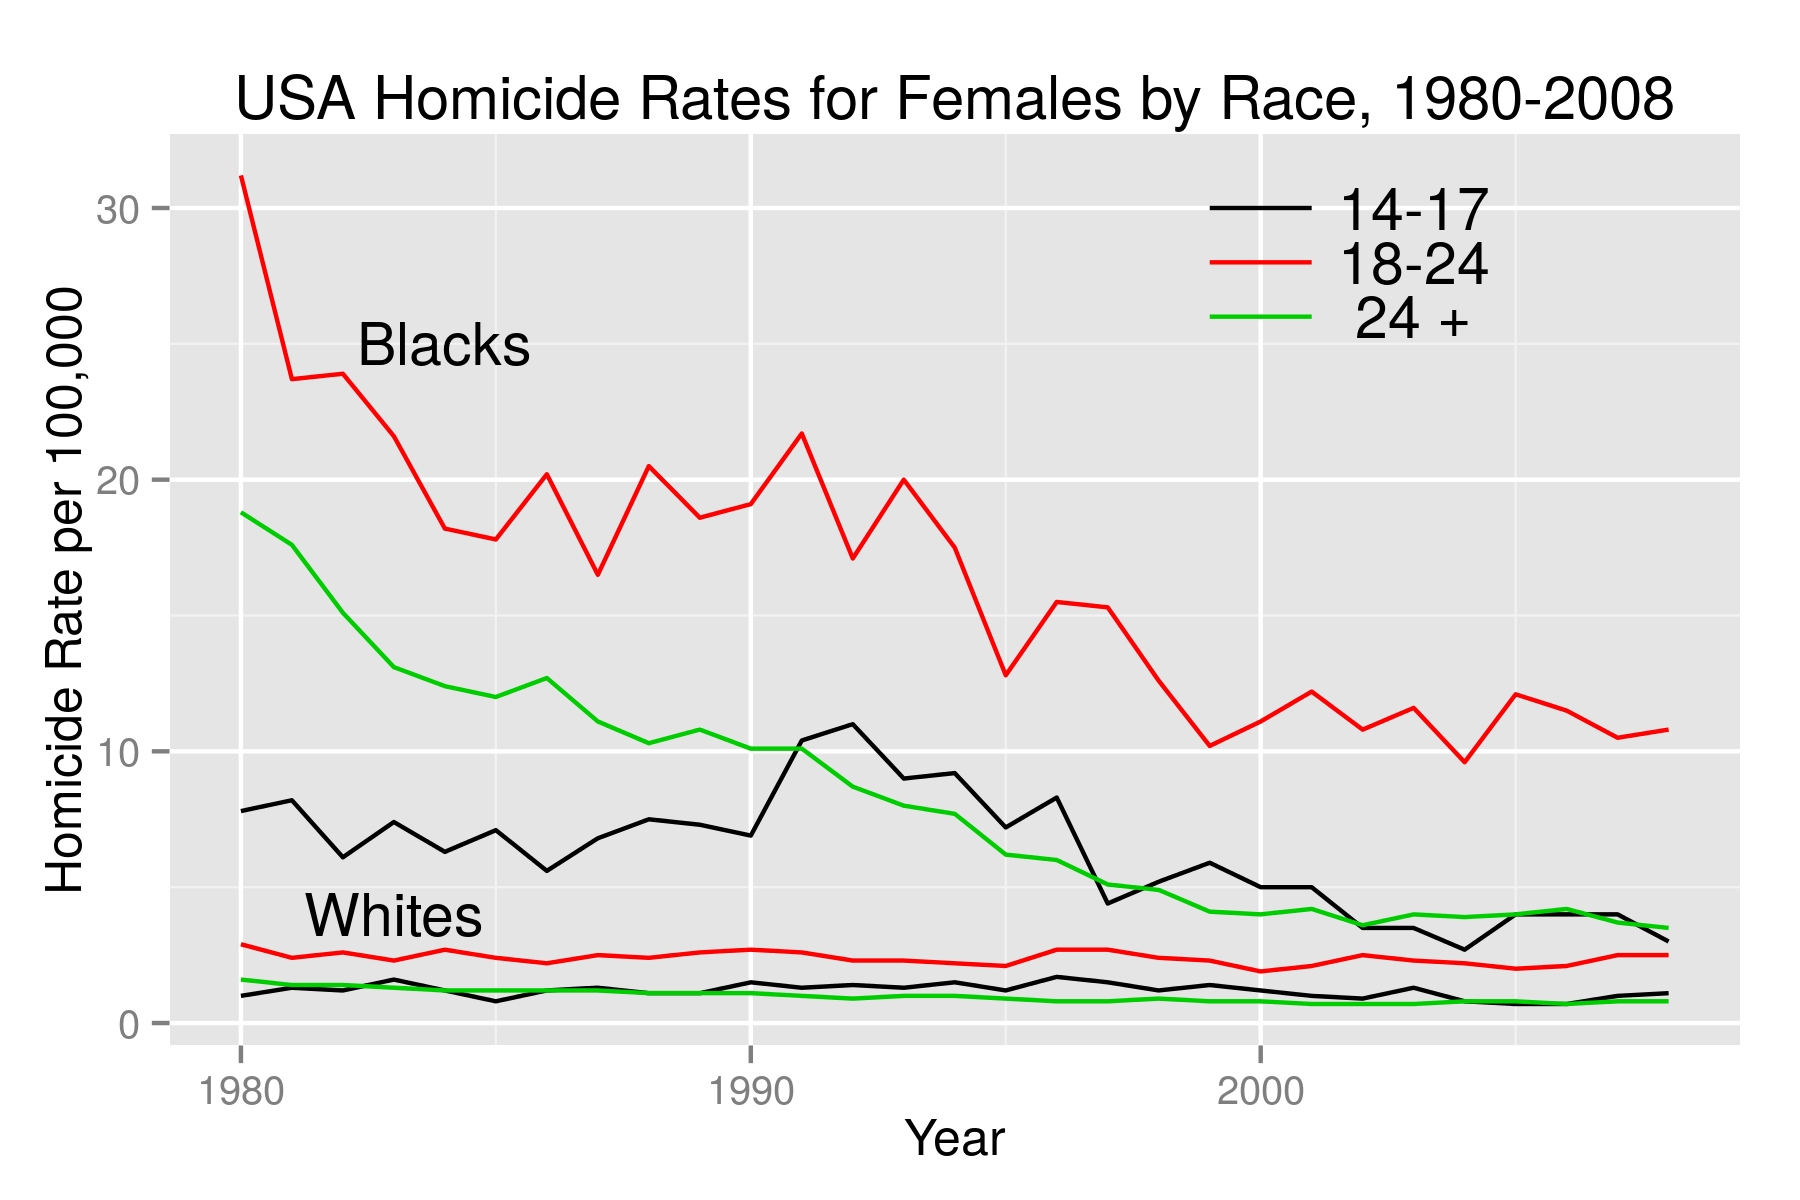
The same trends are obvious, except for the absence of the crack epidemic, which was mostly seen among males. Incidentally, that females are not as murderous as males, black or white, does not accord with Equality theory, which says males and females should not be different.
Guns
Finally, the way homicides are committed is of interest. This last plot using data from the FBI shows the rate at which handguns and other firearms were used in homicides.
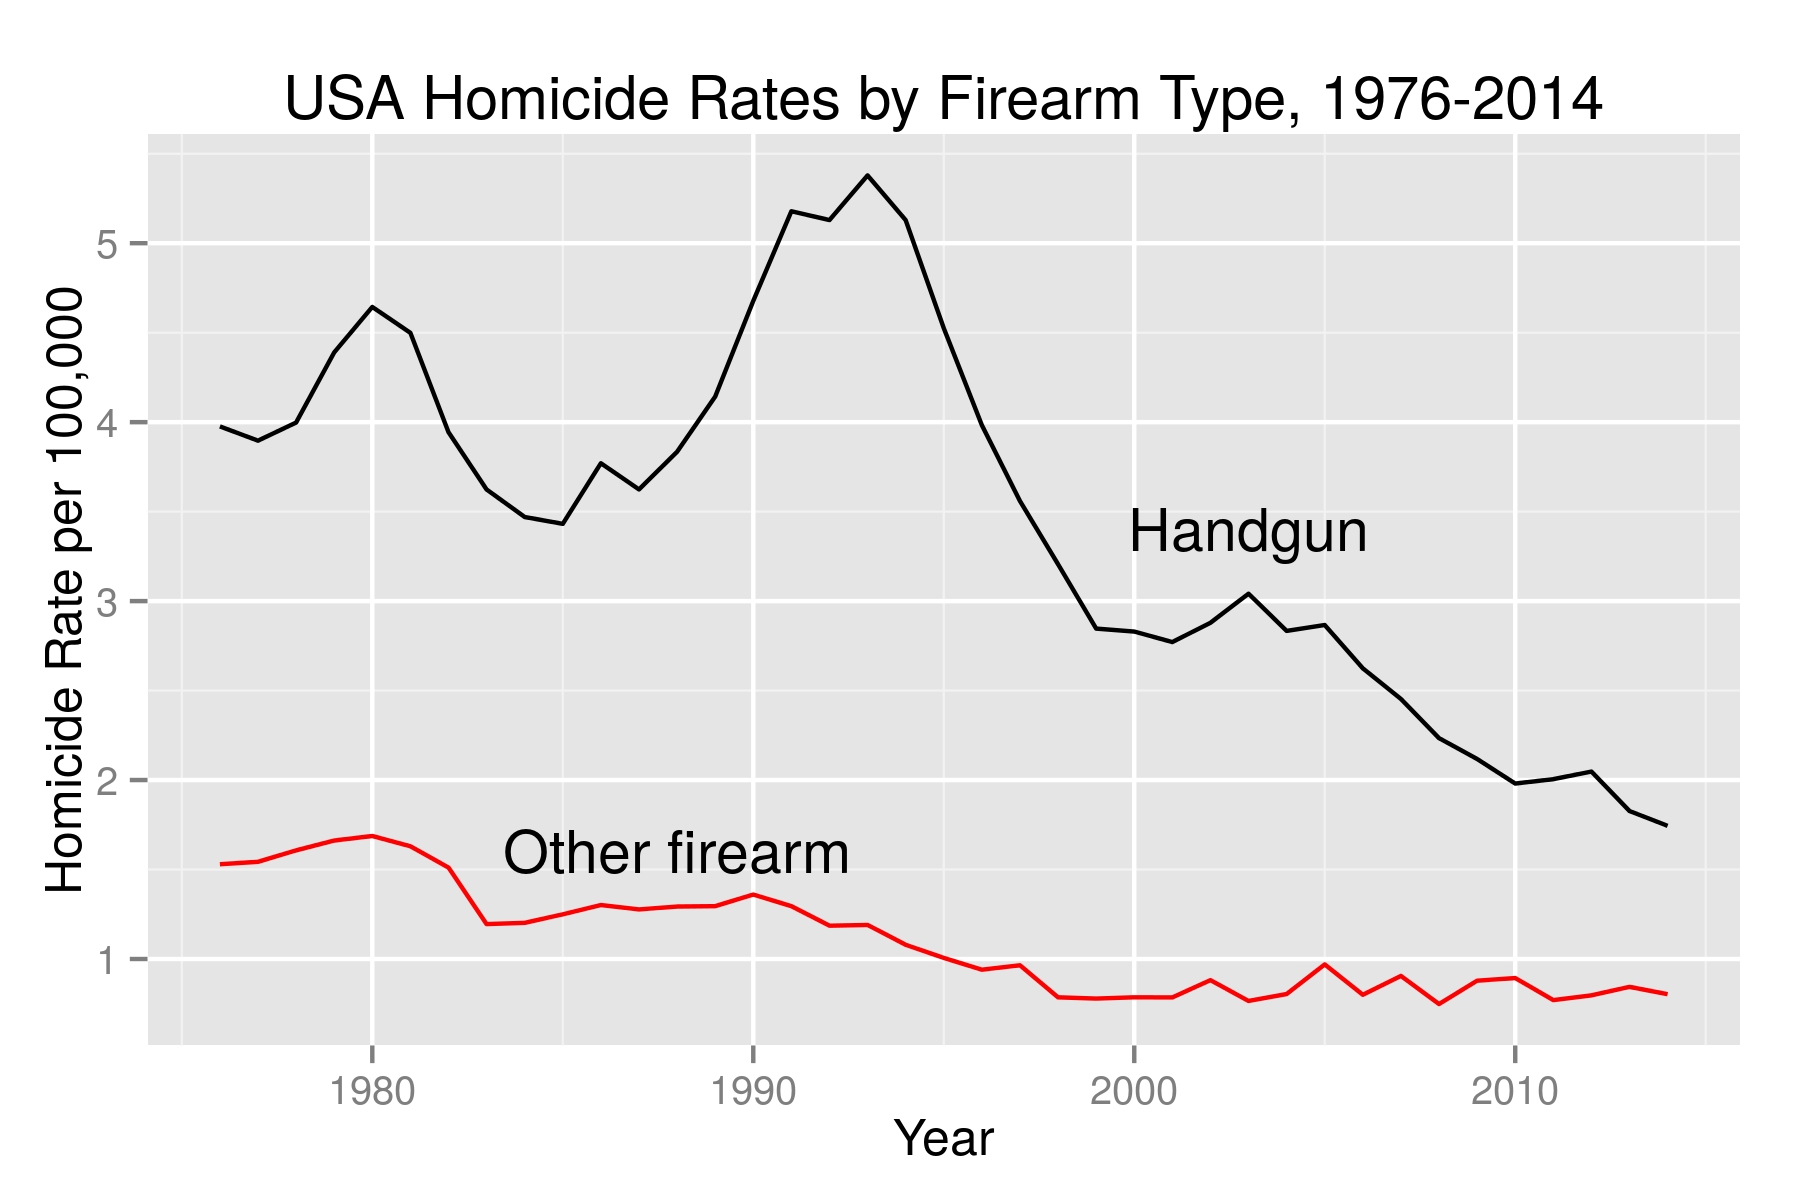
The decline, matching the overall decline in homicide rates, is the most immediate feature. The use of handguns in the crack epidemic is also clear. The FBI also tracks knives, blunt objects, fists of fury, poison, explosives and other means of mayhem, all of which are waning. Given the events in Nice, France, however, it might have to begin counting trucks.
That trucks can be used as deadly weapons proves, as all these plots show, that guns are not a problem, culture is. Wise culture is also the solution, as is also suggested by these graphs.