


There are Serious Voting Anomalies in Pennsylvania
Important update November 11, 8:45 PM: The missing votes (discussed in the first case below) appear to have been a data input error. The totals at the end of the early data I was given were correct. It was only the one time point that was in error. The time step where Trump goes down was due to missing data at that time: the old file I was given at the time stamp has data missing for the totals. The totals before and after are the same in the corrected data. Meaning the first curiosity has been solved: simple data error entry, which only affected the one time point. Here is the PA web site for data. Here is the corrected version of the data I was given (Excel file). For more on this update, see here.
There’s a lot of chatter online about statistical oddities in several states, and I’ve been asked to analyze the votes in Pennsylvania. That work is ongoing, and at the moment, I’m working with limited data. Still, I think there are clear signs that something untoward happened in the Keystone State. Here are a couple of telling examples.
I’ve gotten official county-level timed voting data that started at 11:00 on November 4, the day after the election, to 11:29 on November 7, which is Saturday. So, these are all late vote counts. They start, county by county, where the vote left off on election night.
This is a picture of the running totals by the time the votes were added, summed across all counties, during those time periods. They do not start at 0, but where things were after election night.

The early gains for Biden are mainly from Philadelphia, Allegheny, Montgomery, Chester and Berks counties. A simple plot (click to see: it’s large) shows the size of vote additions for both candidates, when new vote totals (greater than 0) were added by county (and not all counties added votes after election day).
All goes well for Trump until election night, November 4, at 9:15 pm, when he loses just under 10,000 votes. Curiously, this loss is from three different counties simultaneously: -1,063 in Allegheny; -2,972 in Bucks; -7,135 in Chester. Biden never lost any votes (at least, not in this late voting).
This does not mean the decreases happened at that moment. Rather, that’s when they were recorded in the official data.
Biden’s next curiosity was the big increase of 27,396 votes on Nov. 6 at 8:53:00 over one consecutive reporting period. This bump is just like the blue-red F-memes you have seen: this only seems more spread out because of the finer time scale used.
So, three separate counties removed about 10,000 votes from Trump on Wednesday evening. And then late Friday, about 27,000 votes were added for Biden.
This happened after it was clear that this is what Biden would need to push ahead.
These two curiosities account for a 37,263 vote swing for Biden. Biden’s total, as of the end of this data, was 3,344,528, and Trump’s 3,310,326. Biden therefore “won,” in this dataset anyway, by 34,202 votes.
So, three separate counties removed about 10,000 votes from Trump on Wednesday evening. And then late Friday, about 27,000 votes were added for Biden.
This happened after it was clear that this is what Biden would need to push ahead. This needs to be answered.
Votes Added and Deleted
Now let’s look at some other data that shows how hard it can be to spot anomalies. Remember, we’re looking only at county-level voting data additions that occurred after election day through Saturday night.
Now we know huge additions were made to Biden on Wednesday morning. These additions, we’re told, contain a lot of COVID-19 fear inspired mail-in ballots. But I don’t have the breakdown of which are mail-in and which are “native” or other votes.
Again, throughout the days after the election, votes were added to both candidate totals at various times. You’d expect that sometimes the additions would favor Trump, sometimes Biden. The split wouldn’t be 50-50, of course, but would reflect the true underlying vote.
Here’s a picture showing the indexed, low to high, vote additions for each time they happened: there were over 200 of these additions. For instance, at one point (the right-most line) about 45,000 votes were added for Biden; and at the same time about 16,500 for Trump. Those cases where Biden got more votes than Trump are blue. When Trump got more the lines are red.

Trump did come out ahead in the vote additions sometimes, but every single one of the competitions was trivial. They were on the order of 1 vote for Trump, 0 for Biden, or 20 for Trump and 7 for Biden. On the other hand, Biden votes additions were almost always large compared to Trump’s. (But, note: There aren’t any large times where only Biden gained votes. It’s not that obvious.)
Still, the huge early additions to Biden are curious.
Here are the Biden-Trump additions as they occurred, for six counties which for other reasons appear suspicious. Chester and Cumberland had predominately registered Republicans, and yet Biden supposedly beat Obama (in either term) in vote totals by 20-40%! The county names appear at the peak of the differences. For example, late on November 4th, Biden received about 40,000 more votes than Trump in Philadelphia county.
Each line shows the Biden-Trump vote additions for a different county. The county names appear at the peak of the differences.
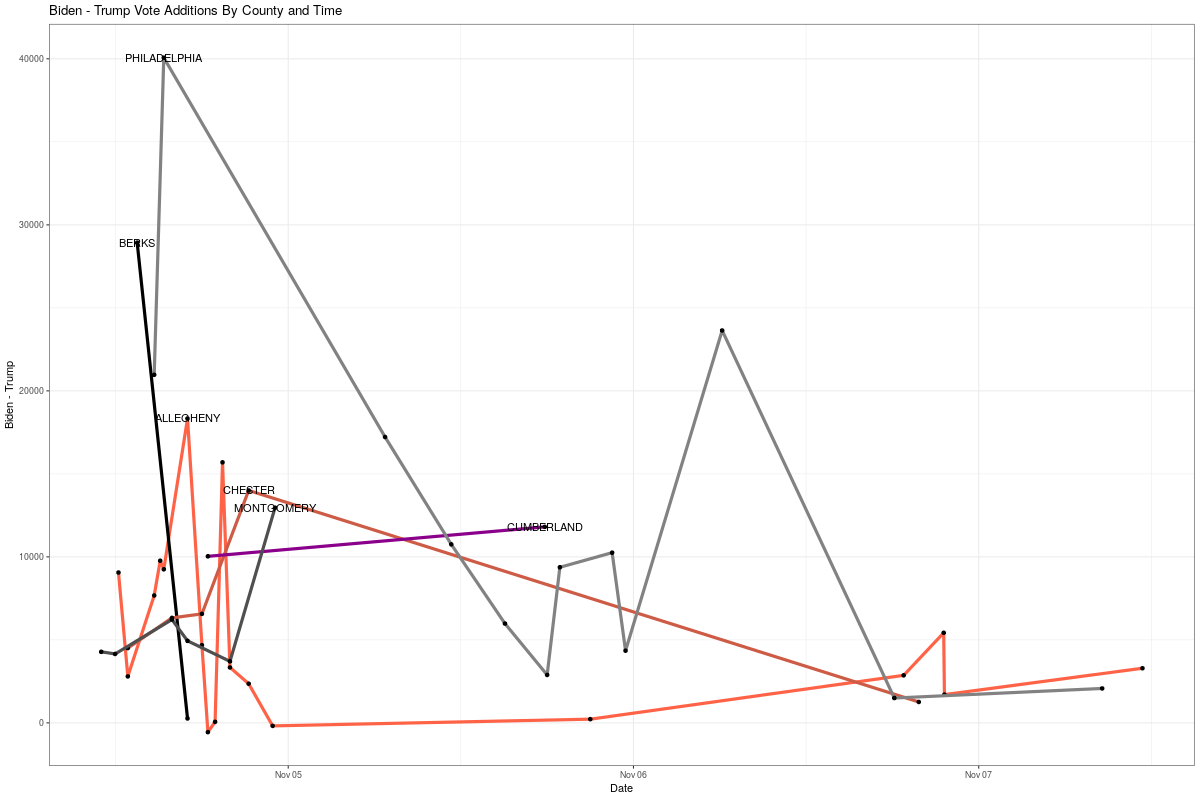
That peak for Philly on the 6th is the one that pushed Biden ahead, which I mentioned above. You can see in these large counties only one time where more Trump than Biden votes were added, and it’s a trivial amount.
This suggests, as you might expect in a machine town saturated in a history of vote tampering, that investigators should concentrate their efforts on the mail-in ballots in Philly.
To really discover something about the mail-in ballots, though, investigators will need to examine each one, and compare them to in-person ballots. They should compare the distribution of patterns. For instance, a large number of supposed mail-ins are only marked for president and none of the other races would be almost definitive proof of cheating, especially considering real people who mailed ballots in had all the time in the world to consider their choices.
Now you know why it was important to keep these late-added ballots separate from the regular ones. Unless, of course, you are committing voter fraud, and want to cover your tracks.
William Briggs is the co-author, with Douglas Axe and Jay W. Richards, of The Price of Panic: How the Tyranny of Experts Turned a Pandemic into a Catastrophe.